Kubernetes Basics and How to Start Learning
Kubernetes Basics and How to Start Learning
Kubernetes is a powerful open-source container orchestration platform that has become the standard for managing containerized applications in cloud-native environments. If you're new to Kubernetes, it can seem overwhelming at first. However, with the right resources and a willingness to learn, anyone can become proficient in Kubernetes.
What is Kubernetes?
At its core, Kubernetes is designed to automate the deployment, scaling, and management of containerized applications. It provides a platform for deploying, scaling, and managing containerized workloads across multiple hosts and clusters, abstracting away the underlying infrastructure and providing a uniform way to manage applications regardless of where they are running.
The key building block of Kubernetes is the pod. A pod is the smallest deployable unit in Kubernetes and represents a single instance of a container. Pods are grouped together in deployments, which define the desired state of a set of pods and manage their lifecycle.
Kubernetes uses a declarative model, meaning that administrators define the desired state of the system and Kubernetes takes care of the details of making it happen. This means that instead of manually configuring each component of the system, administrators can simply declare what they want the system to look like, and Kubernetes will make it so.
Kubernetes also provides a powerful set of features for managing the networking, storage, and security of containerized applications. For example, Kubernetes provides a built-in service discovery mechanism that allows containers to find each other and communicate, even across multiple hosts and clusters.
How to Start Learning Kubernetes
Learning Kubernetes can seem daunting, but there are many resources available to help you get started. Here are a few examples:
Official Kubernetes Documentation The official Kubernetes documentation is an excellent resource for learning Kubernetes. It provides a comprehensive guide to the platform, including detailed information on installation, configuration, and usage. You can find it here: https://kubernetes.io/docs/home/
Kubernetes Bootcamp The Kubernetes Bootcamp is a free, self-paced online course that provides an introduction to Kubernetes. It covers the basics of Kubernetes, including deployment, scaling, and management. You can find it here: https://kubernetesbootcamp.github.io/kubernetes-bootcamp/
Kubernetes the Hard Way Kubernetes the Hard Way is a free, hands-on tutorial that walks you through the process of setting up a Kubernetes cluster from scratch. It's designed to help you gain a deep understanding of how Kubernetes works under the hood. You can find it here: https://github.com/kelseyhightower/kubernetes-the-hard-way
Kubernetes Fundamentals (Pluralsight) Kubernetes Fundamentals is a paid online course from Pluralsight that provides a comprehensive introduction to Kubernetes. It covers topics like deployment, scaling, and networking in depth. You can find it here: https://www.pluralsight.com/courses/kubernetes-fundamentals
Kubernetes Community Slack The Kubernetes Community Slack is a great resource for getting help and advice from other Kubernetes users. You can join the Slack channel here: https://kubernetes.slack.com/join/shared_invite/zt-h6d30gb6-7X9UHbzcCZBMyisZ62Nf2Q#/
Synthetic Monitoring: Improving User Experience through Automated Testing
Synthetic Monitoring: Improving User Experience through Automated Testing
In today's fast-paced digital world, businesses are increasingly relying on websites, applications, and IT systems to connect with customers and drive growth. As a result, it is more important than ever to ensure that these systems are performing at their best, providing a seamless and reliable user experience. Synthetic monitoring is a method of monitoring the performance and availability of these systems that is becoming increasingly popular due to its proactive approach and the insights it provides into the user experience.
What is Synthetic Monitoring?
Synthetic monitoring involves using automated scripts or simulated transactions to monitor the performance and availability of websites, applications, and IT systems. Unlike traditional monitoring methods that rely solely on real user data, synthetic monitoring allows organizations to proactively detect and diagnose issues before they impact real users. Synthetic monitoring tools simulate user behavior, such as navigating through a website or making a purchase, and monitor the response time, availability, and functionality of the system.
Why is Synthetic Monitoring Important?
Synthetic monitoring is important because it provides a proactive approach to monitoring the performance and availability of websites, applications, and IT systems. By simulating user behavior, organizations can identify potential issues before they impact real users, reducing downtime and improving the overall user experience. Synthetic monitoring can also help organizations to:
- Ensure consistent performance: Synthetic monitoring allows organizations to monitor the performance of their systems on a continuous basis, ensuring that they are meeting performance goals and delivering a consistent user experience.
- Improve availability: By proactively monitoring the availability of their systems, organizations can reduce downtime and ensure that their systems are always accessible to users.
- Diagnose issues quickly: Synthetic monitoring tools provide detailed insights into system performance, allowing organizations to quickly diagnose issues and resolve them before they impact real users.
- Optimize user experience: By monitoring the user experience, synthetic monitoring tools can help organizations to identify areas for improvement and optimize their systems to deliver a better user experience.
- Synthetic Monitoring Tools
There are many synthetic monitoring tools available in the market, ranging from commercial solutions to open source tools. Some of the popular commercial solutions include New Relic Synthetics, Dynatrace Synthetic Monitoring, and Pingdom. These tools provide real-time monitoring and alerts for websites and applications, allowing organizations to proactively detect and diagnose issues.
For organizations with limited budgets or those that want to try synthetic monitoring before investing in a commercial solution, there are open source tools available as well. Apache JMeter, Gatling, and Tsung are a few examples of open source synthetic monitoring tools that offer a cost-effective way to get started with synthetic monitoring.
Conclusion
Synthetic monitoring is a powerful tool for monitoring the performance and availability of websites, applications, and IT systems. By simulating user behavior and monitoring the response time, availability, and functionality of systems, organizations can proactively detect and diagnose issues before they impact real users. Synthetic monitoring allows organizations to ensure consistent performance, improve availability, diagnose issues quickly, and optimize the user experience. Whether you choose a commercial solution or an open source tool, synthetic monitoring is a critical component of any organization's IT monitoring strategy.
MS-SQL HA database backup using Powershell and Ansible, Step by Step - 3 -
Installing & Setting up Ansible on Linux server (ubuntu 18.04)
Ansible installation on Linux:
1. Get a Linux machine (ubuntu 18.4 server) from your environment. (Here we used Azure's VM.)
2. Login to the deployed Linux server using SSH and run the following commands to install Ansible.
Update apt-get and install python
 sudo apt-get update

 sudo apt-get upgrade -y

 sudo apt-get install python -y
Update Ansible repo & install Ansible
sudo apt-add-repository ppa:ansible/ansible

sudo apt-get update

sudo  apt-get install ansible -y
3. Configure SSH (optional for Linux managed nodes)
For this instruction, this is an out of scope but in case you need a Linux managed node that is running automation, you have to do these steps.
Configure SSH
ssh-keygen

Key file's path and an ssh passphrase will be asked like above. Store them in a secure place.
Copy SSH public key
cat <your ssh key file's path>.pub
e.g.
Copy the public key shown above, and store it somewhere.
Login to your Linux managed node.
Issue the command
sudo -s
Open the authorized_key file with the following command
sudo vi ~/.ssh/authorized_keys (Past the public key that you got previous step, and write & quit.)
The authorized_keys should be same as the publick key you have created previously.
Now you can test SSH between them.
sudo ssh <ansible host username>@<ansible managed host server name>
4. Create an Ansible inventory hosts file on the Ansible server
sudo vi /etc/ansible/hosts
Edit hosts like below format:
[winserver]
<your windows server FQDN>

[winserver:vars]
snaible_winrm_port=5986
ansible_connection=winrm
ansible_winrm_transport=credssp
ansible_winrm_server_cert_validation=ignore
5. Create an Ansible play-book yml
sudo vi sqlAutobackup.yml
Edit sqlAutobackup.yml like below:
- name: Powershell for ms-sql database backup
  hosts : winserver
  gather_facts: false

  vars:
   ansible_user: "<your winrm username for ansible server>"
   ansible_password: "<password>"

  tasks:
   - win_command: powershell.exe
     args:
      stdin: <your powershell script path in the remote windows host>
User name and password are the ones that you have created in this step:
3. Create an service account for Ansible
MS-SQL HA database backup using Powershell and Ansible, Step by Step - 2 - - Gonzablogstdin's powershell script should be the one you have created in this step:
Run the below script to back up all sql database on this host.
MS-SQL HA database backup using Powershell and Ansible, Step by Step - 1 - - GonzablogIn this example, a plain text is used for the password and the username, which is, of course, not secure (although only root user can see it). This should be encrypted by the ansilbe vault or other key vault services. I will post how to do it at a later date!
6. Test run
Try to run the sql database backup playbook from Ansible server:
sudo ansible-playbook ~/sqlAutobackup.yml -vvvv
Note: -vvvv is a debug mode switch.
You will the outputs something like this:
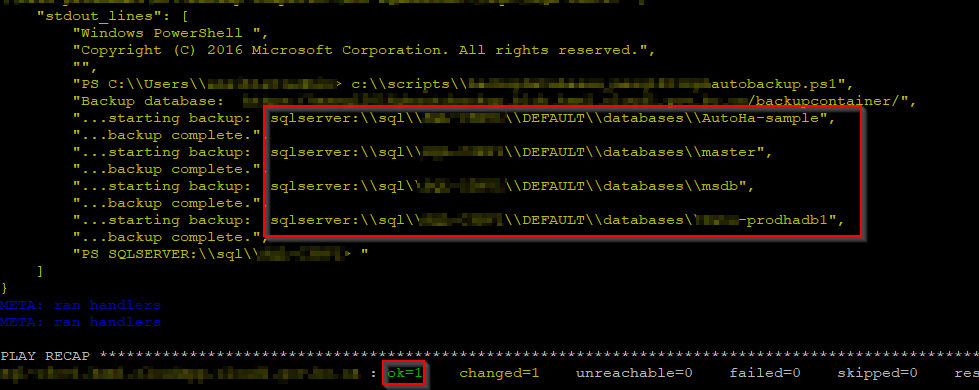
In debug mode outputs, you should see all databases like red box above, and "PLAY RECAP" should show "ok=1".
7. Set up a Cron entry for an schedule backup
To set up an schedule backup, add an entry to Ansible user's crontab.
sudo crontab -u <your winrm username for ansible server> -e
The below entry will backup sql databases in every 6 hours:
#Run ansible playbook under the user "ansible-winrm user".
0 */6 * * * sudo ansible-playbook /home/<ansible-winrm user>/sqlAutobackup.yml
"wq!" to save the crontab.
Wait and see if this schedule yml will backup as expected.
--END
References:
How to install Ansible on Ubuntu Server 18.04 - TechRepublic
Setting up a Windows Host — Ansible Documentation
MS-SQL HA database backup using Powershell and Ansible, Step by Step - 2 -
Setting up WinRM
Unlike the integration with Linux or UNIX like servers and Ansible, Windows machines cannot use SSH for Ansible integration, just yet(*1) . Thus, you will have to use Windows Remote Manager (WinRM) , instead.
1. Install WinRM Memory Hotfix on Windows server
Run the following PowerShell script to install the hotfix:
$url = "https://raw.githubusercontent.com/jborean93/ansible-windows/master/scripts/Install-WMF3Hotfix.ps1"
$file = "$env:temp\Install-WMF3Hotfix.ps1"

(New-Object -TypeName System.Net.WebClient).DownloadFile($url, $file)
powershell.exe -ExecutionPolicy ByPass -File $file -Verbose
2. Configure WinRM
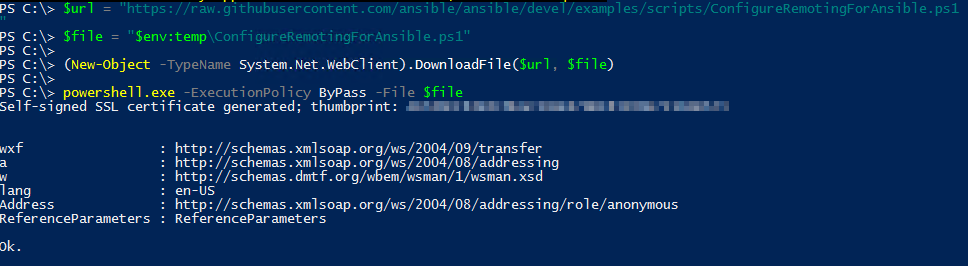
Run the following PowerShell script to setup WinRM HTTP/HTTPS listeners with a self-signed certs and the basic authentication.
$url = "https://raw.githubusercontent.com/ansible/ansible/devel/examples/scripts/ConfigureRemotingForAnsible.ps1"
$file = "$env:temp\ConfigureRemotingForAnsible.ps1"

(New-Object -TypeName System.Net.WebClient).DownloadFile($url, $file)

powershell.exe -ExecutionPolicy ByPass -File $file
e.g.
Now, check WinRM's status:
winrm enumerate winrm/config/Listener
e.g.
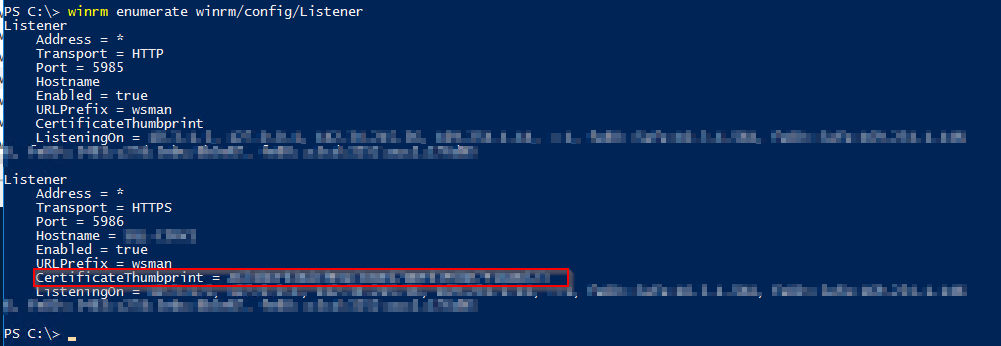
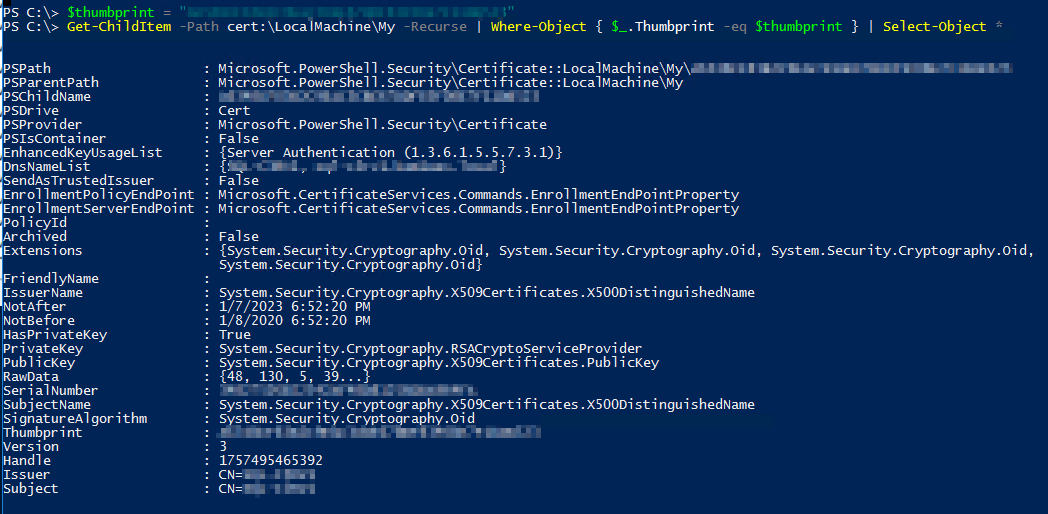
Take note of the CertificateThumbprint (red rectangle above), and run below getting the details of the certificate:
$thumbprint = "<your certificateThumbprint>"
Get-ChildItem -Path cert:\LocalMachine\My -Recurse | Where-Object { $_.Thumbprint -eq $thumbprint } | Select-Object *
e.g.
To check the current WinRM service configuration, run the following commands:
winrm get winrm/config/Service
winrm get winrm/config/Winrs
3. Create an service account for Ansible
To connect Windows machine, set up a service account for Ansible access.
Add user:
net user <username> <password> /add
Add the created user to the Administrator group:
net localgroup administrators <username> /add
e.g.

4. Add the created user to MS-SQL server's sysadmin.
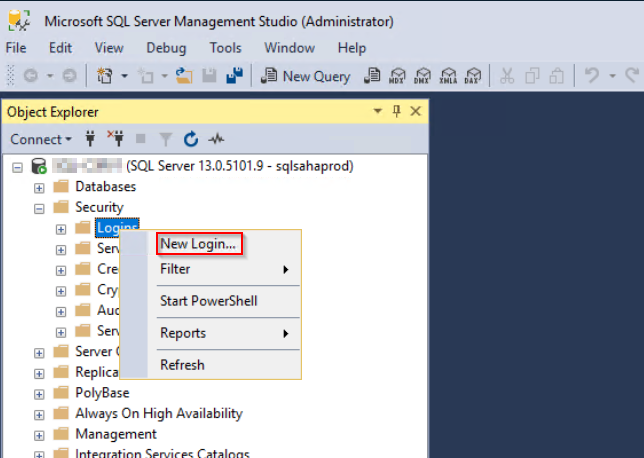
Login to the Windows machine and launch up MS SQL Server Management Studio:
Navigate toSecurity > Logins, right click and New login.
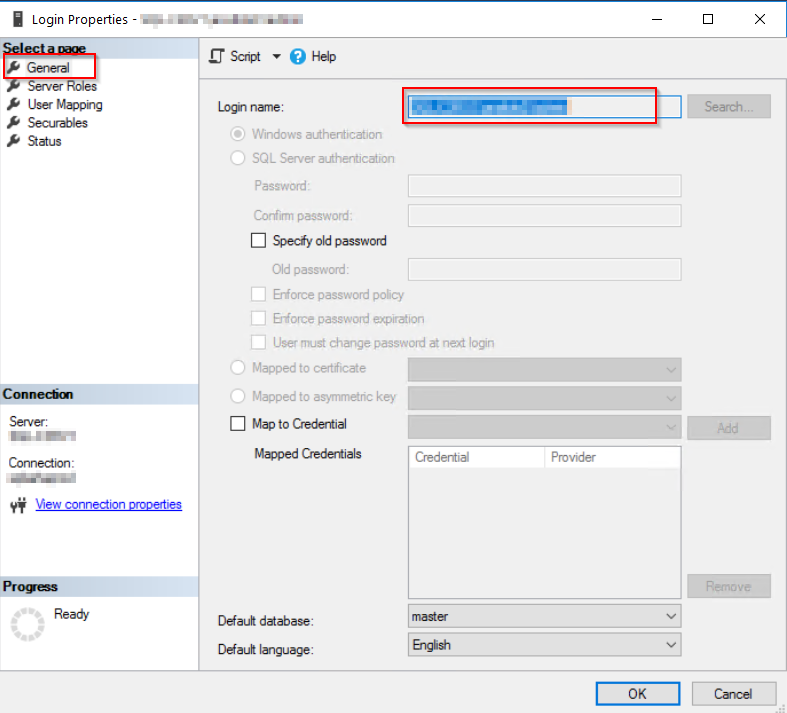
Enter user name that has been created in the previous step:
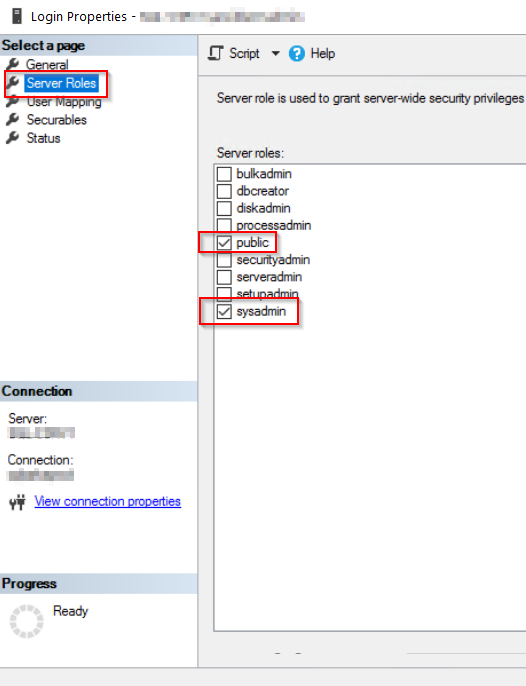
Set Check sysadmin.
Check if SQL connection below
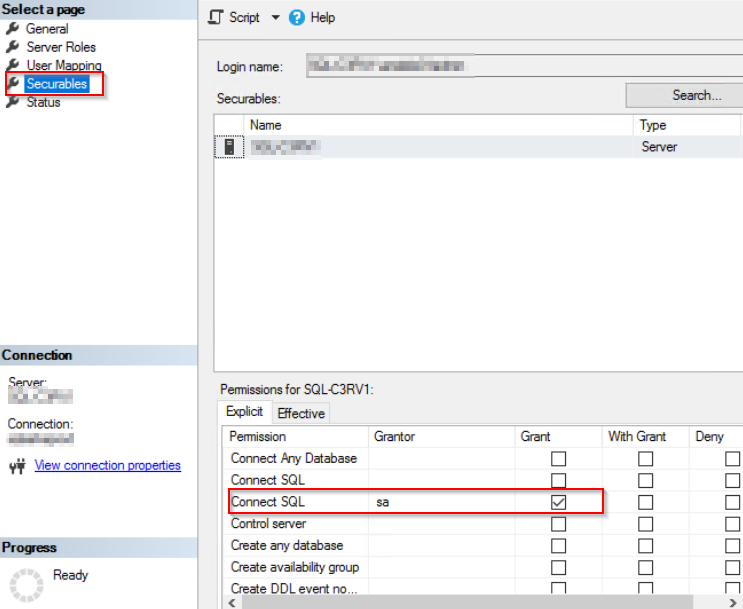
Click OK to close, and log off from MSSMS.
Note: if you don't like to give a database sa permission to the ansible user, modify the permission as required. (This particular user should be visible to the all databases under this SQL host server as it will search and backup them all. )
5. Test HTTP/HTTPS connection
- These tests can be done on the localhost or a remote host that WinRM ports(5985/5986) is opened.
- Username and password are the ones you have created at the step 3.
- Testing's Windows server name will be the "Issure Name" of certificate (CN field value of certificate's details ) .
HTTP test
winrs -r:http://<Windows server hostname>:5985/wsman -u:<username> -p:<password> ipconfig
HTTPS test
winrs -r:https://<Windows server hostname>:5986/wsman -u:<username> -p:<password> -ssl ipconfig
Note: This HTTPS test will fail if the certs is not verifiable.
e.g.

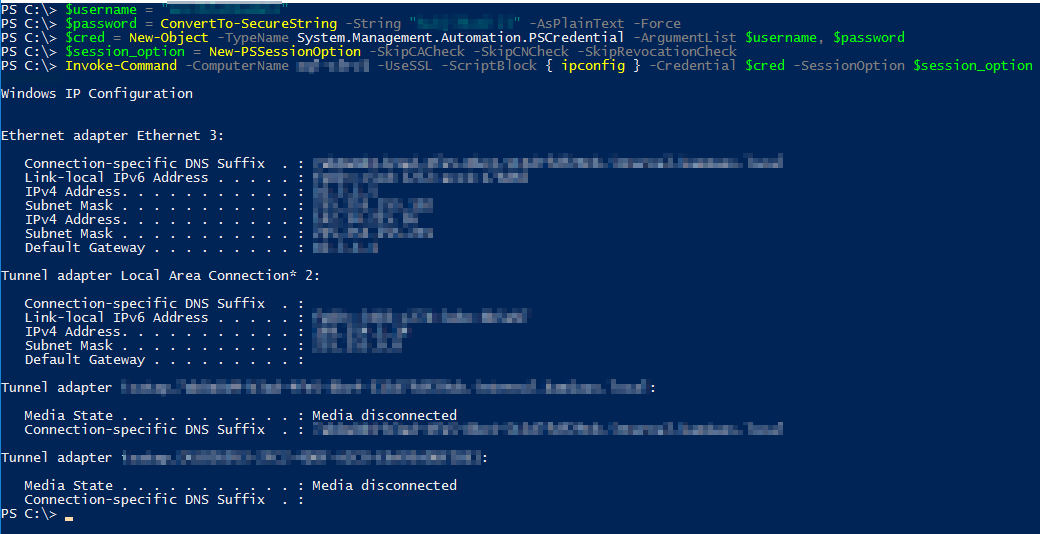
If you get that error, setup below: HTTPStest, ignoring certificate verification
$username = "<username>"
$password = ConvertTo-SecureString -String "<password>" -AsPlainText -Force
$cred = New-Object -TypeName System.Management.Automation.PSCredential -ArgumentList $username, $password

$session_option = New-PSSessionOption -SkipCACheck -SkipCNCheck -SkipRevocationCheck
Invoke-Command -ComputerName <Windows server hostname> -UseSSL -ScriptBlock { ipconfig } -Credential $cred -SessionOption $session_option
e.g.
Reference
Setting up a Windows Host — Ansible Documentation
How to install Ansible on Ubuntu Server 18.04 - TechRepublic
experimental SSH connection for Windows managed nodes (*1) Looks like there is an experimental SSH integration for Windows servers. But do it at your own risk :)
To be continued... (Next would be steps on the Ansilbe server.)
MS-SQL HA database backup using Powershell and Ansible, Step by Step - 1 -
Backgaroud :
Currently Azure Stack HUB's MS-SQL HA deployment uisng the sql-2016-alwayson ARM template is not supporting the automated backup which is otherwise supported for MS-SQL standalone database as discribed below.
This works only for the standalone deployment so that you will have to get some other ways to backup your HA databases.
Reference:
Built-in support for SQL Server Always On :

#Autmated Backup is not supported on this matrix.
Solution summary:
MS support recommended (we opned the support call for this) us to use 3rd party backup tools to backup HA databases, such as NetBackup. That's the one way of doing it. But here, we have implemented like below:
- Set up a powershell script to backup all databases in the MS-SQL HA.
- Run the powershell script using Ansible.
# Backup location we uses is Azure Stack's blob storage.
Storage account & Powershell Backup script:
1. Create a blob storage within the Azure Stack HUB and get a storage account Key.
From the Azure Stack HUB user portal, navigate to "Dashborad > Resource groups > <Your Resource group>"
Click "+ Add"

Add a new "Storage Account" for an SQL backup.

Enter a storage account name and other fields as required, and click "Review + Create"

Create a new blob container.
Navigate to "Dashborad > Resource groups > <Your Resource group> > <your storage account name> - Blobs", and click "+ Container".

Check the newly created storage account and get a Access Key infomation.
Navigate to "Dashborad > Resource groups > <Your Resource group> > <your storage account name> ".
And select "Access keys" and keep your storage accout name and its key.

Also check "properties" and get your "PRIMARY BLOB SERVICE ENDPOINT".

2. Create an SQL credential on all instances of SQL Server.
On the SQL server host, launch Windows powerShell ISE. And run the script below:
#==========
#Create cred:
#==========
# load the sqlps module
import-module sqlps
# set parameters
$sqlPath = "sqlserver:\sql\$($env:COMPUTERNAME)"
$storageAccount = "<your storage accout name>"
$storageKey = "<your storage accout key>"
$secureString = ConvertTo-SecureString $storageKey -AsPlainText -Force
$credentialName = "BackupCredential-$(Get-Random)"
Write-Host "Generate credential: " $credentialName
#cd to sql server and get instances
cd $sqlPath
$instances = Get-ChildItem
#loop through instances and create a SQL credential, output any errors
foreach ($instance in $instances) {
try {
$path = "$($sqlPath)\$($instance.DisplayName)\credentials"
New-SqlCredential -Name $credentialName -Identity $storageAccount -Secret $secureString -Path $path -ea Stop | Out-Null
Write-Host "...generated credential $($path)\$($credentialName)." }
catch { Write-Host $_.Exception.Message } }
This script will generate a Backup credential like below:

Keep this "BackupCredential-xxxxx" credential.
Next, run the below script to back up all sql database on this host.
#==========
#Run backup
#==========
import-module sqlps
$sqlPath = "sqlserver:\sql\$($env:COMPUTERNAME)"
$storageAccount = "<your storage accout name>"
$blobContainer = "<your container name>"
$backupUrlContainer = "https://<primary endpoint URL>/$blobContainer/"
$credentialName = "BackupCredential-<backup cred number>"
Write-Host "Backup database: " $backupUrlContainer
cd $sqlPath
$instances = Get-ChildItem
#loop through instances and backup all databases (excluding tempdb and model)
foreach ($instance in $instances) {
$path = "$($sqlPath)\$($instance.DisplayName)\databases"
$databases = Get-ChildItem -Force -Path $path | Where-object {$_.name -ne "tempdb" -and $_.name -ne "model"}
foreach ($database in $databases) {
try {
$databasePath = "$($path)\$($database.Name)"
Write-Host "...starting backup: " $databasePath
Backup-SqlDatabase -Database $database.Name -Path $path -BackupContainer $backupUrlContainer -SqlCredential $credentialName -Compression On
Write-Host "...backup complete." }
catch { Write-Host $_.Exception.Message } } }
This script will backup all databases except "tempdb" and "model" databsaes.
After running the script, check if all sql databases have been saved to the blob storage.

# The scripts that we have run are essentially followed the scripts in this article. Recommend to read this reference for details.
To be continued. (Next would be an WinRM for Ansilbe integration)
Nagios XI WMI agent-less monitoring for Azure Stack HUB Windows Virtual Machine, Step by Step.
It was a bit struggle to set up an WMI agentless monitoring for Windows VMs in Microsoft Azure Stack HUB (MASH) , so here is the memo I've been through.
-System environment
Monitoring Server: Linux VM in MASH (Ubuntu 18.01.1)
Monitoring Server Size: Standard DS2 v2 (2 vcpus, 7 GB memory)
Moniroting Software: Nagios XI (5.6.9)
Monitored Server: Windows VM in MASH (Windows 2019 DC)
Monitored Server Size: Standard DS2 v2 (2 vcpus, 7 GB memory)
Notes:
1. To simplify the network environment, They are in the same IP subnet and there is no dedicated FWs in between other than Netwrok Security Group (NSG) setting for each Virtual Machines which is provided by MASH, and Windows firewall on the Windows VM. (Later steps shows how to set them up.)
2. You shoud try the below reference documnet first, and see if Nagios XI's WMI agentless monitoring works in your envioroment. If it doesn't work, try my steps.
Reference document:
https://assets.nagios.com/downloads/nagiosxi/docs/Monitoring-Windows-Using-WMI-and-Nagios-XI.pdf
3. Maybe you can consider to set up an agent based monitoring, such as NCPA, if these WMI monitoring settings didn't work for you.
- Nagios XI WMI agent-less monitoring set up -
-- On WIndows Virtual Machine:
1. Create an WMI service accout.
net user <service account name> <password> /add
e.g.
net user wmiagent wmiaget /add
# ! You shoud use more complex pw in yours, of course!
2. Adding Remote Activation Priviladge to WIndows DCOM.
Start > Run > DCOMcnfg.exe

Navigate "Component Service > Computers and properties of My Computer".
And Select "COM Security > Edit Item" under the "Launch and Activation Permissions".

Add the created user "wmiagent".

Select these permissions below for the user "wmiagent".

And click "OK" to save.
3. Adding Remote WMI Access.
Start > RUN > WMImgmt.msc

Right click on "WMI Control (Local)" and select "Properties".
And Select Security Tab > CIMV2 and click "Security".

Click "Add...." button and add "wmiagent". Then select the follwoing permissions below for wmi user.

Click OK to save.
4. Windows Firewall settings
Server Manager > Tools > Windows Firewall with Advanced Security
Select "Inbound Rules" > "Filter by Group" and select " Filter by Windows Management Instrumentation (WMI)".

Make sure these two inbound rules are enabled like below:

5. Set WMI user to the "Performance Log Users" Group
Server Manager > Tools > Computer Management
Add the user "wmiagent" to the "Performance Log Users Group" like below:

Click OK to save.
6. Set Additional Permissions
On the Windows machine, Check SID for the WMI user account (wmiagent) by running the following command;
wmic useraccount where name='wmiagent' get sid
The output will be something like this:
SID
S-1-5-21-xxxxxxxx-xxxxxxxxx-xxxxxxxxx-xxxx
Keep this SID somewhere, and check the current security descriptor (SD) for SCMANAGER.
sc sdshow SCMANAGER
The output will be like this:
D:(A;;CC;;;AU)(A;;CCLCRPRC;;;IU)(A;;CCLCRPRC;;;SU)(A;;CCLCRPWPRC;;;SY)(A;;KA;;;BA)(A;;CC;;;AC)(A;;CC;;;S-1-15-3-xxxx-528118966-xxxxxxxxxx-xxxxxxxxx-xxxxxxxxxx-xxxxxxxxxx-xxxxxxxxxx-xxxxxxxxx-xxxxxxxxxx)S:(AU;FA;KA;;;WD)(AU;OIIOFA;GA;;;WD)
You need to add an entry to the SD that contains your SID,
(A;;CCLCRPRC;;;<SID>)
For example using the SID above:
(A;;CCLCRPRC;;; S-1-5-21-xxxxxxxx-xxxxxxxxx-xxxxxxxxx-xxxx)
This needs to be inserted to the beginning of the SD after the D:, using the example above it looks like:
sc sdset SCMANAGER D:(A;;CCLCRPRC;;;S-1-5-21-xxxxxxxx-xxxxxxxxx-xxxxxxxxx-xxxx)(A;;CC;;;AU)(A;;CCLCRPRC;;;IU)(A;;CCLCRPRC;;;SU)(A;;CCLCRPWPRC;;;SY)(A;;KA;;;BA)(A;;CC;;;AC)(A;;CC;;;S-1-15-3-xxxx-528118966-xxxxxxxxxx-xxxxxxxxx-xxxxxxxxxx-xxxxxxxxxx-xxxxxxxxxx-xxxxxxxxx-xxxxxxxxxx)S:(AU;FA;KA;;;WD)(AU;OIIOFA;GA;;;WD)
Run 'sc sdshow SCMANAGER' again to check the new SD has been set.
7. Set Fixed WMI Port (135 and 24158)
Since Azure Stack HUB's NSG allows connection through its port specification, WMI which uses dynamic ports by default have to be changed to the fixed port setting.
On the Windows machine, run the following command (from admin CMD);
winmgmt -standalonehost
Restart WMI service:
net stop winmgmt
net start winmgmt
Set a firewall rule for the fixed WMI port:
netsh firewall add portopening TCP 24158 WMIFixedPort
Check if Fixed port is set on the windows machine (Optional)
On the Windows DCOM console, navigate to " Computers > My Computer > DCOM Config > Windows Management & Instrumentation"
And check its properties:

You should see the "Use static endpoint" is selected and shows "24158" as a default port number.
Note: You will have to set up a new NSG rule for the fixed WMI ports (135 and 24158 both) for both Virtual Machines in Azure Stack HUB.
Ref: https://support.quest.com/kb/114559/how-to-set-a-static-fixed-wmi-port-in-windows
https://docs.microsoft.com/en-us/windows/win32/wmisdk/setting-up-a-fixed-port-for-wmi
-- On Nagios XI server:
1. Set up hosts for WMI monitored servers.
sudo vi /etc/hosts
Add host's entries of monitoring target hosts using below format:
.
.
# WMI monitoring
<IP Address> <FQDN> <hostname>
Write and quit (wq!) from the vi.
Check if wmic command can now reached to wmi monitoring hosts or not:
CPU check using FQDN:
$ /usr/local/nagios/libexec/check_wmi_plus.pl -H <target's FQDN> -u 'wmiagent' -p '<PW>' -m checkcpu -w '60' -c '70'
OK (Sample Period 74 sec) - Average CPU Utilisation 0.30%|'Avg CPU Utilisation'=0.30%;60;70;
CPU check using IP address:
$ /usr/local/nagios/libexec/check_wmi_plus.pl -H <target host's IP> -u 'wmiagent' -p '<PW>' -m checkcpu -w '60' -c '70'
OK (Sample Period 1 sec) - Average CPU Utilisation 2.15%|'Avg CPU Utilisation'=2.15%;60;70;
2. Set up Authentication file for WMI auth.
Create an authentication file (as a hidden file):
sudo vi /usr/local/nagios/etc/.wmi_auth
username=wmiagent
password=<PW>
Write and Quit (wq!) from the vi.
Check auth file's current permission. (It's 644 and belong to root group.)
$ sudo ls -ltr /usr/local/nagios/etc/.wmi_auth
-rw-r--r-- 1 root root 38 Jan 3 14:47 /usr/local/nagios/etc/.wmi_auth
Change its mode from 644 to 640 and set it to "nagios" group so that only users belong to nagios group can read:
$ sudo chmod 640 /usr/local/nagios/etc/.wmi_auth
$ sudo chgrp nagios /usr/local/nagios/etc/.wmi_auth
Check if both have been changed:
$ ls -ltr /usr/local/nagios/etc/.wmi_auth
-rw-r----- 1 root nagios 38 Jan 3 14:47 /usr/local/nagios/etc/.wmi_auth
-- On Nagios XI Web GUI:
Set up WMI monitoring using Auth file.
Navigate to "Configure > Configuration Wizards".

...and select Windows WMI wizard:

Enter FQDN or IP address of your target host and specify the Auth file you've created.

Also increase the Trancate output Length to 65536.
Set up discovered monitors as required.

Note: MASH doesn't allow ICMPs' traffic as of now (2020 Jan) so the ICMP ping monitor won't work (always shows as an unreachable alert). So here, it shoud be checked off like above. To monitor node's up/down, maybe the other ping monitors, such as telnet, URL check or other port monitoring check would be considered.
Change intervals and notifications as required.


Click Finish to save.
Check if now Naigos XI is polling setup monitors:

-- Trouble shooting:

If you see this kind of message on the Nagios Xi Web Console, run below:
Check if a state file exists under the /tmp on Nagios xi server:
$ sudo ls -ltr /tmp/*.state
-rw-rw-r-- 1 nagiosxi01admin nagiosxi01admin 202 Jan 3 15:26 /tmp/cwpss_checkcpu__xxxxxxxxxx___.state
Remove all state files:
$ sudo rm -f /tmp/*.state
Check it again, and should see this message:
$ sudo ls -ltr /tmp/*.state
ls: cannot access '/tmp/*.state': No such file or directory
Check if there is no more "UNKNOWN - Permission denied when trying to store the state data." message on the Nagios XI.
--End
平成30年7月豪雨 4
4.何はともあれ、直接行くほかない。ボランティアの募集はまだ始まっていなかったが(それどころではないのだろう。。。)、日本での活動日数も限られているので、早々に出発することにした。問題の滞在先も、従兄弟の話によると彼の家周辺は電気も回復し、水道も節水制限はあるものの支障はさほどないとのことで、泊めてもらえることになった。
東京駅から高速夜行バスで向かう道すがら、いろいろな思いが去来する。家族の様子はどうなのか?田舎のみんなは?どうして土手が複数個所も決壊したのか?テレビやネットのニュースでは専門家がバックウォーター現象などが要因のひとつと指摘していたが、そんなことは今に始まったわけではない。小田川もその下流で合流する高梁川も太古の昔から存在し、したがってバックウォーター現象も昔からあった。その対策のために土手は作られ存在し、またその機能を果たしてきた。問題は、どうして今になって土手が決壊したのかだ。
今回豪雨の前に帰省して、ひとつ違和感を持ったのは、土手と土手の間の河川敷がかつてのようにすっきりしておらず、桑や竹やその他の樹木が、両岸にかかる橋の高さを超えるほどに成長しすっかり森のようになっていたことだ。帰省中、一度甥っ子の迎えに地元の小学校から連絡があったため行ったのだが、その理由が橋の欄干に猿がいるのが目撃されたため、だった。猿なんぞ僕の小学生時代(ちなみに同じ小学校に通っていた)にはお目にかかったことがなかった。(もちろん近くの山にはいただろうが。)猿の生態に詳しいわけではないが、猿が人里に出没するようになったのは、河川敷の森林化もあったのかもしれない。
さらに土手自体も、僕が住んでいた頃は(高校卒業時まで)、きちんと土手の草が上から下まで草刈トラクターによって定期的に刈り込まれていた。が、今回見た土手は上から三分の一くらいまでが刈り込まれていただけだった。これも洪水シーズンだから中ほどは残していたのかも知れないが、家族によれば、かつてほどパトロールも草刈も行われていないようだった。
おそらくは、これらは管理主体(一級河川なのでこの場合は国土交通省?)の河川管理予算の削減の結果ではないかと思われた。河川敷の森林化にはいい面もあるのだろう、それ自体によって下流に水を”流れにくく”し洪水の影響を減少させる効果もあると聞いたことがある。でもこうした集中豪雨の場合、人における動脈硬化よろしく、森の木々たちが抵抗となり、水が滞留し、さらにバックウォーターにより水かさが上昇、よって通常以上の水圧がかかり、破裂・決壊したのではないか。もちろんこれは単なる素人考えで、具体的な数字を持っているわけではないが、河川敷の森林化は地元もかねてから懸念し、県や国に陳情がなされていたようだ。
バスは格安片道6000円の割りに三列で比較的広かったが、シートが僕には微妙に合わないのもあって、ほとんど眠れない。途中途中で止まるサービスエリアで降りて吸う空気が気持ちよかった。

兵庫辺りのサービスエリア。
悶々と考えながらも、翌朝7時半ごろ倉敷駅ターミナルに無事ついた。従兄弟のK君がピックアップに来てくれていた。